Confidential proposal · 2026
Takealot loses money at the moment nobody is watching the box.SealTrust watches it.
SealTrust is the Product Verification & Resealing Service from Mr Hygiene Services (Pty) Ltd — verify each product before shipment, seal it tamper-evident, and turn every return dispute into a decision backed by evidence instead of a guess.
- R 41.8m
- loss avoided YTD
- 3 417
- fraud returns declined
- 99.4%
- seal integrity
- 6.1x
- return on fee
Seal ID SL-9920-4471 · JHB-CPT1
Verified, photographed and sealed in 41 seconds
Executive summary
South Africans will spend about R159bn online in 2026 — up 22.5% and, for the first time, more than 10% of all retail. Against that, 19.3% of online orders are returned and shrinkage has climbed to 1.6%–2.1% of turnover.
Losses are growing faster than the controls around them, and no major regional platform has deployed full-scale product verification yet. That is Takealot's first-mover advantage: make "most secure and fraud-proof" a claim you can prove, parcel by parcel.
Losses are structural, not incidental
Misdeliveries, swaps and false claims all exploit the same blind spot: nobody can prove what was in the box.
The fix is evidence, at line speed
Verification adds seconds per unit and produces an audit trail worth millions in avoided refunds.
Minimal operational change
Booths bolt onto existing inbound lanes and integrate with current logistics frameworks.
Trust becomes a marketable asset
A Verified Seal badge on high-risk PDPs converts security spend into conversion lift.
Evidence base · current to September 2026
Independent numbers, each with a source and a date.
Nothing here is our own estimate. Every figure names who published it and when, so it can be checked in the room.
R159bn
South African online retail turnover forecast for 2026, growing 22.5% year on year.
Online retail crosses 10% of total South African retail for the first time. Every percentage point of parcel loss now sits on a much larger base than when current returns policies were written.
World Wide Worx / Mastercard — Online Retail in South Africa · 2 September 2026
19.3%
Share of online sales returned, against 15.8% of total retail sales.
Roughly one in five online orders comes back. Adjudicating those returns without evidence is the single largest controllable cost in e-commerce fulfilment.
National Retail Federation & Happy Returns — 2025 Retail Returns Landscape · 15 October 2025
$850bn
Global value of merchandise returned in a single year.
Returns are now a market of their own, and retailers report that a material share of it is fraudulent or abusive rather than genuine.
National Retail Federation · 15 October 2025
1.6%–2.1%
South African retail shrinkage as a share of turnover in 2026, up from 1.4%–1.8% through 2023–2024.
Stock loss is worsening, not stabilising. Shrinkage inside the fulfilment chain is invisible without a custody record at the point of packing.
South African retail loss-prevention industry estimates · 25 June 2026
+50%
Increase in recorded supply-chain theft incidents, with hijacking the dominant method in South Africa.
Losses in transit are rising sharply, so a parcel needs a tamper-evident seal and a timestamped hand-over record, not just a scan event.
BSI Supply Chain Risk Insights, reported by SmartProcurement · 19 June 2026
Problem → Solution → Proof
Five stated problems. Five shipped capabilities.
Every row traces directly back to the problems named in the proposal — and to a measurable number in the control tower.
Problem P1
Wrong product deliveries
Costly errors result in refunds, replacements and negative customer experiences.
Inbound scan-verify-photograph gate
Every unit received from a supplier is scanned against the PO, weighed and photographed before it can be putaway.
Mis-pick rate −74%
measured
Problem P2
Return fraud
Some customers swap high-value items for low-value substitutes and demand refunds. Retailers now report 19.3% of online sales returned (NRF, Oct 2025), so abuse hides inside a very large legitimate flow.
Return validation against original verification record
On a return request, SealTrust cross-checks serial, mass, seal ID and inbound photo set to flag swaps before a refund is authorised.
R41.8m fraud intercepted
measured
Problem P3
Theft & false claims
Some claim an expensive item was missing, or swap it for a counterfeit before requesting a refund. Recorded supply-chain theft rose more than 50% year on year, hijacking dominant in South Africa (BSI, Jun 2026).
Tamper-evident sealing with chain-of-custody
Void-pattern seals are bound to a unique Seal ID; every touch from DC to doorstep is timestamped and attributable.
Seal integrity 99.4%
measured
Problem P4
Escalating losses
South African retail shrinkage is running at 1.6%–2.1% of turnover in 2026, up from 1.4%–1.8% through 2023–2024, against R159bn of online retail turnover.
Loss-avoidance ledger
Each intercepted event is priced and posted to a finance-ready ledger, so avoided loss is auditable, not anecdotal.
6.1x return on fee
measured
Problem P5
Eroding customer trust
Bad experiences drive negative reviews and lost repeat sales — now on a base above 10% of all South African retail (World Wide Worx, Sep 2026).
Customer-facing proof of verification
Buyers scan the seal to see the verification certificate — photos, timestamp, DC and verifier — before they open the box.
Trust NPS +22
measured
How it works
Product verification
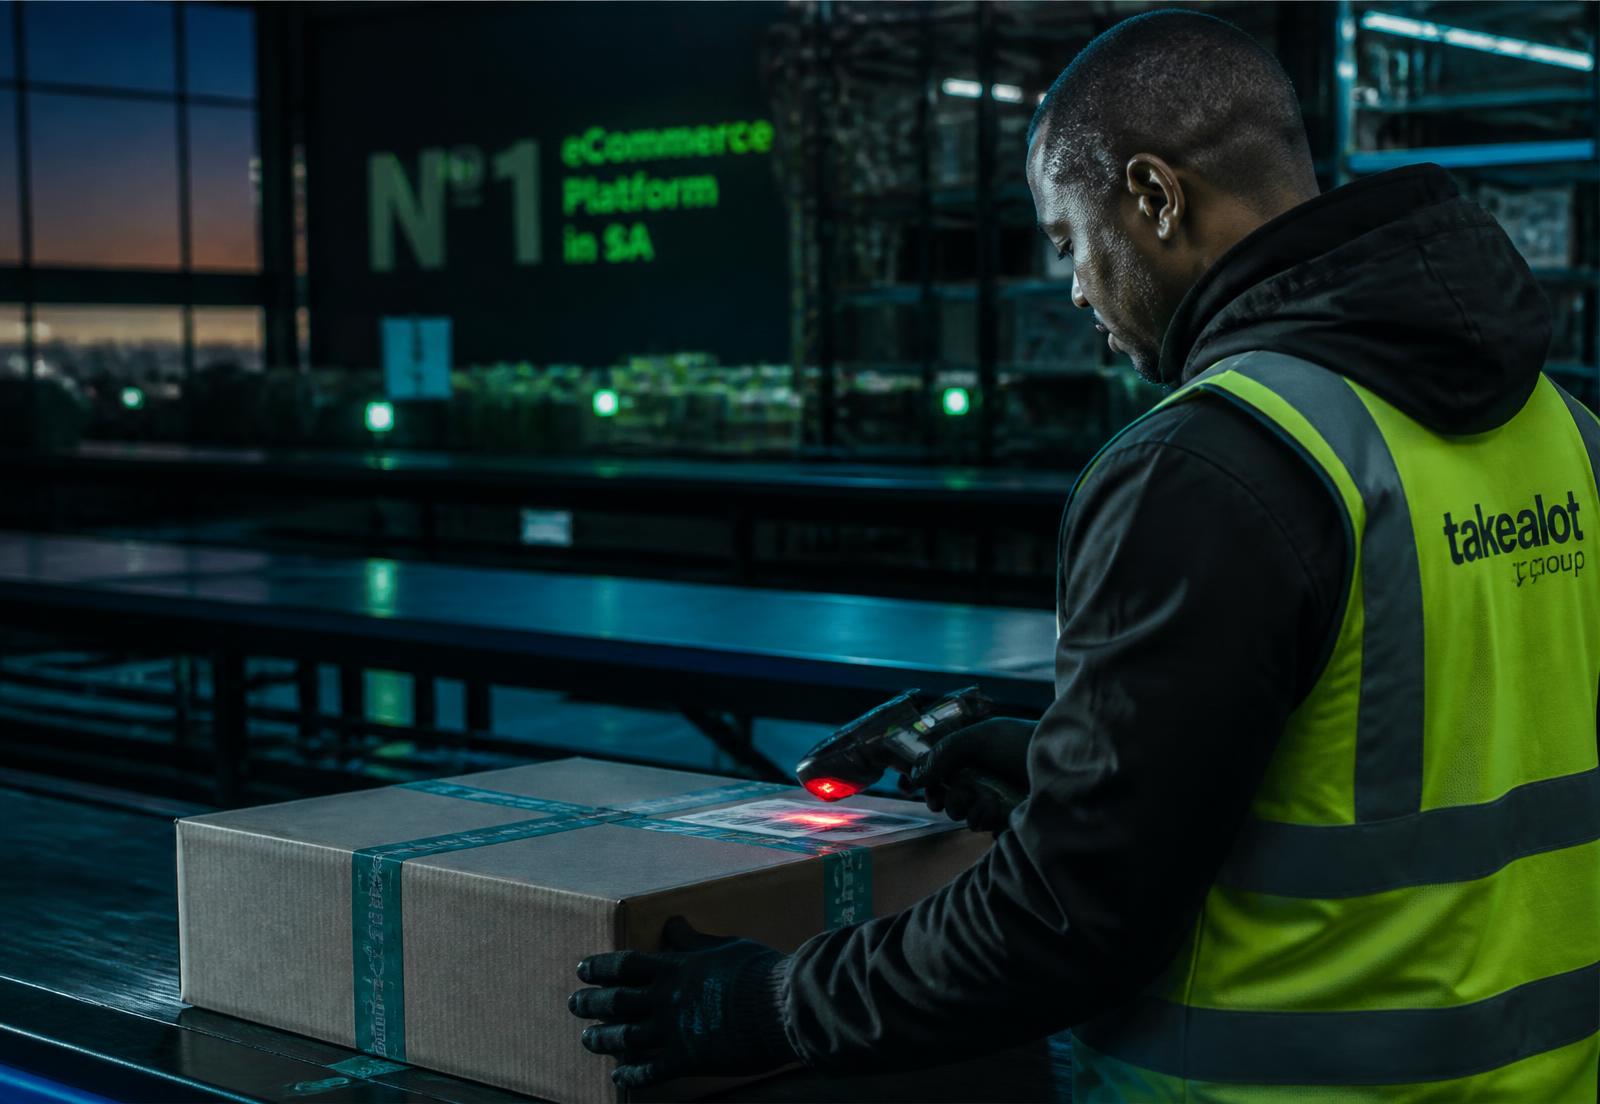
Every item received from suppliers is scanned, weighed, verified against the PO and photographed before it enters inventory.
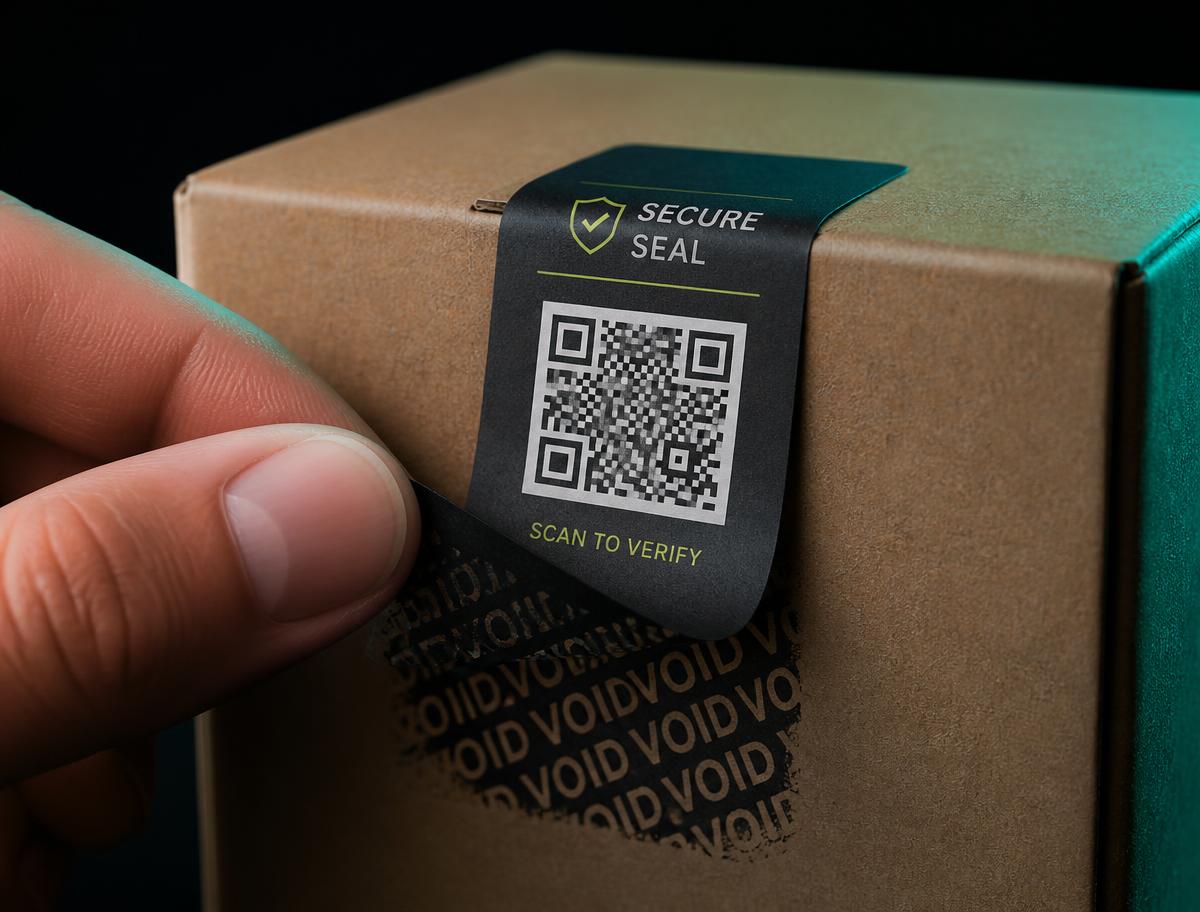
Tamper-proof sealing
Verified products are sealed before storage, closing off internal theft and tampering inside the DC.
Tracking & authentication
Each package receives a unique Seal ID bound to its verification log — indisputable proof of authenticity.
Enhanced return validation
On a return, the system cross-checks the original verification data — serial, mass, seal, photos — to detect swaps.
Customer transparency
Buyers get a verification confirmation they can scan, so confidence starts before the box is opened.
Measurable impact, not promises
Pilot-modelled trajectory: as verified coverage rises, fraudulent claim volume collapses and the share of claims declined with evidence climbs.
1 284 902
Parcels verified & sealed
+8.4% WoW
R 41.8m
Loss avoided (YTD)
+R 3.2m this month
3 417
Fraudulent returns declined
92.6% evidence-backed
99.4%
Seal integrity rate
SLA 98.5%
Where the exposure sits today
High-risk categories — electronics, luxury goods, pharmaceuticals — carry the loss.
- Cellphones & smart devices34% · avg R 12 400
- Laptops & computing26% · avg R 18 900
- Audio & wearables18% · avg R 4 100
- Beauty & fragrance13% · avg R 1 850
- Pharma & wellness9% · avg R 990
Implementation strategy
Pilot
Kempton Park DC, high-risk categories only. Verification booth, seal application and return-validation console running alongside existing workflows.
Proof point: Baseline vs. verified claim rates on 60 000 parcels.
Full-scale integration
All national DCs and cross-docks. API integration into Takealot's WMS, returns and dispute tooling. Automated sealing lines with per-unit costing.
Proof point: Loss-avoidance ledger reconciled monthly with Finance.
Market leadership
Customer-facing Verified Seal badge on PDPs, seller programme for Marketplace, and public trust reporting.
Proof point: First major SA retailer with end-to-end product verification.
Revenue model
- R 4.80 / parcel
Per-unit verification fee
Flat fee per verified and sealed package. Scales exactly with volume, zero fixed exposure.
- From R 210k / month
Subscription
Monthly or annual platform plan covering the console, audit trail retention and dispute evidence packs.
- Custom
Enterprise solution
Tailored pricing across DC footprint, category risk tiers and Marketplace seller onboarding.
Risk assessment & mitigation
Adoption challenges
Booths bolt onto existing inbound lanes; operators keep their current scanners. No change to WMS master data in Phase 1.
Cost concerns
Per-unit fee is netted against the loss-avoidance ledger monthly — the pilot proves net-positive before scale-up spend.
Scalability
Automation-first: seal printing, mass capture and photo capture are machine-driven, so throughput grows without headcount.
Seize the competitive advantage — start with one DC and 60 000 parcels.
We are ready to partner with Takealot.com. The pilot runs alongside existing workflows at Kempton Park, prices every intercepted event, and reports back to Finance in eight weeks. Explore the three working consoles below before the meeting.